Glossary of terms
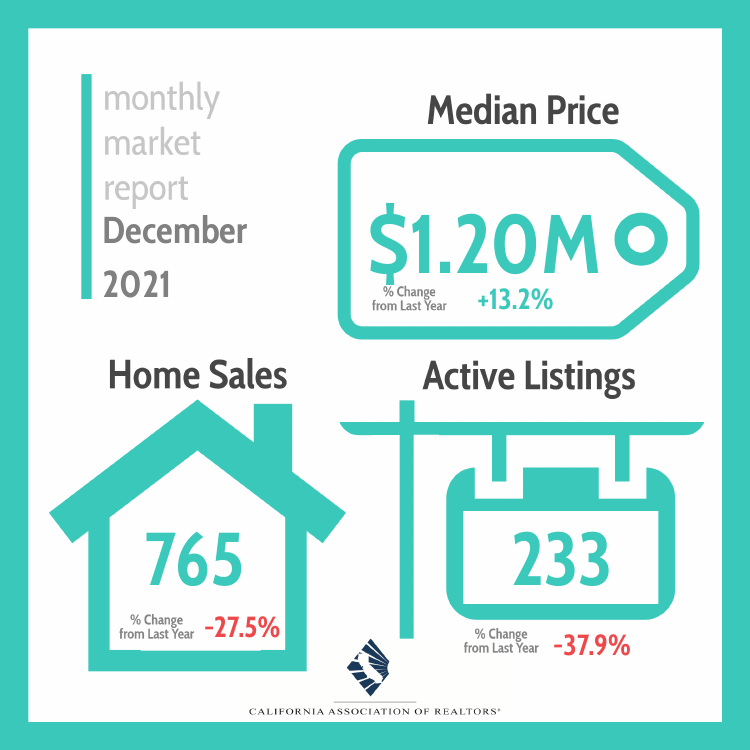
Existing SFR Home Sales: Number of Single-Family Residence (SFR) homes sold during the month.
- A negative % change from last year means that there were fewer homes sold compared to same time last year.
- A positive % change from last year means that there were more homes sold compared to same time last year.
Active Listings: Number of homes available for sale during the month.
- A negative % change from last year means that there were fewer homes available for sale compared to same time last year.
- A positive % change from last year means that there were more homes available for sale compared to same time last year.
Existing SFR Median Price: The median price of Single-Family Residence (SFR) homes sold during the month.
- A negative % change from last year means that homes were less expensive compared to same time last year.
- A positive % change from last year means that homes were more expensive compared to same time last year.
Median Days on Market: The median of the number of days properties were on the market before going Pending.
- This is a good indicator of buyer demand in a given market. Homes taking longer to sell indicates slower demand from buyers while homes selling more quickly indicates an increase in buyer demand.
Sales-to-List Price %: The final sale price at close of escrow relative to the seller’s asking price.
- This is a measure of discounting. If the sales-to-list price ratio is below 100%, sellers are typically receiving less than their full asking price for their homes. If the sales-to-list price is above 100%, sellers are typically receiving more than their full asking price for their homes.
% of Active Listings Reduced: The percentage of homes available for sale that have reduced their asking price.
- This is another measure of discounting. A high percentage of active listings reduced suggests that more sellers in the market lowered the asking price of their homes, while a low percentage of active listings reduced suggests that fewer sellers in the market lowered the asking price of their properties.
Feel free to email us your questions, feedback or other comments to research@car.org.
Note: The median price and sales data depicted in the graphics are generated from a survey of more than 90 associations of REALTORS® throughout the state and represent statistics of existing single-family detached homes only. Sales data are not adjusted to account for seasonal factors that can influence home sales. Movements in sales prices should not be interpreted as changes in the cost of a standard home. The median price is where half sold for more and half sold for less; medians are more typical than average prices, which are skewed by a relatively small share of transactions at either the lower-end or the upper-end. Median prices can be influenced by changes in cost, as well as changes in the characteristics and the size of homes sold. The change in median prices should not be construed as actual price changes in specific homes.